


Objectives, actions and results
To concretely implement sustainability in the economic, financial, environmental and social fields, the Group has outlined shared strategic objectives and actions oriented towards the development of communities and territories, in line with its business model.
We are convinced that the processes of an economic activity are only really sustainable if they manage to preserve, increase or minimize the consumption of the capital which is used for the production of value.
A vision on which we have decided to invest effort and resources by developing a Sustainable Value Creation Plan ) that, starting from the analysis of the evolution of the external environment, Identifies objectives and actions that can have a positive impact on the capital we draw.
An innovative model, which we have articulated in three pillars to which correspond as many lines of action, with defined commitments and measurable targets: Planet, People and Partnerships.
Through this approach we place stakeholders at the center of our commitment, transparently implementing actions and projects to contribute to the achievement of the Sustainable Development Goals of the UN 2030 Agenda and create long-term value, For the Group and all the actors involved.
Our performance
We communicate our sustainability performance to stakeholders, providing a transparent view of Italgas’ commitment and impact.
Since 2016 we have been reporting on our environmental, social and governance actions and achievements.
We started with our first Sustainability Report, and then from 2017 we prepared the Non-Financial Statement pursuant to Legislative Decree 254/2016. After three editions, in 2020 we have chosen to inaugurate a new season of our reporting by publishing the Italgas Group’s first Integrated Annual Report. The intention is to provide an effective and transparent representation of the company’s ability to create value over time, reporting financial and non-financial performance in an integrated manner.
We adopt the GRI Sustainability Reporting Standards, published in 2016 by the Global Reporting Initiative, according to the “In accordance – Core” option and refer to the guiding principles and content elements set out in the International Integrated Reporting Framework issued by the International Integrated Reporting Council.
In addition, the reported indicators are audited by an external company.
Italgas updates its materiality analysis on an annual basis, taking into account stakeholder requests, changes in the regulatory environment, the Group’s strategy, and any drivers that could significantly affect its ability to generate value in the short, medium, and long term. Our materiality assessment for the Integrated Annual Report 2024 is based on the principle of double materiality, in line with CSRD requirements. In parallel, we maintain a prioritization of material topics through a complementary approach, ensuring transparency and comparability while meeting investor expectations and sustainability rating requirements. In addition to the double materiality analysis, in 2024 the Group carried out a specific assessment of the external environment and its strategy, which confirmed the validity of the results of the materiality analysis (GRI-compliant) conducted in the 2023 financial year. This confirmation applies to both Impact Materiality (impacts generated, inside-out perspective) and Financial Materiality (impacts suffered, outside-in perspective).
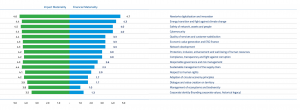
prioritized The following summary provides an overview of the main impacts —prioritized according to the evaluation criteria of likelihood and magnitude —generated and suffered in relation to Italgas’ material issues.
GOVERNANCE
Italgas has set governance mechanisms to oversee information security activities. In Italgas the Control, Risk and Related Party Transactions Committee, in its role of oversight of risks, oversees also those related to cybersecurity and information security. According to the Scope of Skills, Knowledge and Experience matrix of the Board of directors published in the Corporate Governance Report 2024 Paolo Gallo (CEO) and Gianmarco Montanari (independent board member) hold cybersecurity competences based on their education and professional characteristics. In the executive committee, Alessandro Menna in its role of Chief Security Officer oversees information security issues and reports to the Board of Directors and Control Bodies on the level of conformity with national and international regulations on cybersecurity and the corporate policies on technical-organizational measures able to manage risks and prevent cyber incidents.
POLICY
Italgas has adopted an integrated approach to security to manage different levels of information, i.e. the digital data and infrastructure domain, the physical asset domain and the information domain, with the aim of managing vulnerabilities, threats and security events through an Integrated Security System. Through this integrated approach, Italgas supports business resilience, protects sensitive data and ensures continuity of service. Italgas’s Compliance Standard for Integrated Security, Resilience and Crisis Management outlines the key principles, strategy and organizational measures for managing information security across the entire Group. This standard, which is available to all employees, clearly defines the management of information security within the organization. Among the compliance standards, Italgas has a Cyber Security Standard, which defines roles, processes, and procedures to protect the Group’s digital infrastructure from cyber threats that could impact data integrity, the business continuity or the level of quality of services provided, including provision how to promptly respond to potential incidents and define and implement mitigation strategies.
The policy adopted by the Group for managing information security includes the following main pillars and principles:
- The development of cybersecurity capabilities and the update of existing ones, with the aim of continuously improving information security systems. Italgas adopts best practices in information system management to guarantee business continuity, both implementing technologies and protecting and securing its information systems, in line with the evolution of European legislative frameworks and directives and national measures. Indeed, the Group regularly upgrades its cybersecurity capabilities and adapts its systems to respond to new risks and threats;
- The clear definition of the roles and individual responsibilities with regards to cybersecurity within the organization and for the entire workforce
- The protection of integrity, confidentiality, and availability of data: access to information is strictly managed based on the principle of “least privilege,” granting access based on specific roles.
- The monitoring by the ERM Department of the risks connected with cybersecurity in the corporate risk portfolio, including the periodic update of risks;
- The collaboration and information sharing with national and international authorities and institutions to promote continuous updates, improve knowledge of best practices, and exchange information on threats, vulnerabilities, new services, products, and/or technologies.
- The employment of tools such as data loss prevention tools to protect and prevent the loss of critical data, cyber threat intelligence tools and processes to continuous monitor, identify and respond to cyber threats and cyber-attacks that could impact the organization, vulnerability management systems to detect application and infrastructure vulnerabilities of IT and OT systems, multi-factor authentication technologies to increase the level of security and protection of accesses and identities;
- The conduction of specific info sessions for corporate governance bodies relative to Italian and international legislation.
Regarding the management of “Third Parties,” in line with its polices, Italgas defines the information security requirements necessary to limit the risks associated with access to information and regulates their access to information processing devices by implementing appropriate security controls.In addition, the Group identifies suppliers and classifies them based on cyber risk, conducting due diligence activities and applying specific security measures according to the risk level of the suppliers.
MANAGEMENT PROCESS
Italgas has an information security program in place, with defined security-related business continuity plans. In a dynamic threat landscape, Italgas continuously monitors emerging cyber risk scenarios, including supply chain vulnerabilities, geopolitical tensions, extreme weather events, cyberattacks, sensitive data breaches and challenges posed by emerging technologies such as artificial intelligence and machine learning. Special attention is given to the protection of confidential data and business continuity. Italgas has started from 2020 a progressive program on security issues, implementing technological and process activities, with the aim of consolidating the operational capabilities required to enable and increase the level of resilience against external and internal threats, ensuring the protection of physical and logical assets, processes and people. In particular, the cybersecurity capabilities ensure the protection of IT (Information Technology), OT (Operational Technology) and IoT (Internet of Things) systems. The Group guarantees 24-hour monitoring and management of security events through a Next Generation Security Operation Centre (Next Generation-SOC), which also guides and supports the incident management process according to established industry practices. The Security Operation Centre is constantly working to improve security monitoring activities.
In the last two years, Italgas has: a) implemented a Dynamic Threat Map, for real-time monitoring of attack vectors on the exposed digital perimeter; b) consolidated Cyber Threat Intelligence processes in order to pre-emptively identify cyber threats and multi-domain evidence; c) implemented new features and capabilities to protect sensitive data inside and outside company premises in order to protect against unauthorised access or the transmission of confidential information; d) adopted a platform that simulates different types of attacks in an automated manner to detect breach points within company perimeters; e) implemented mechanisms for the authentication of e-mail messages.
The Group also performs regular IT and OT vulnerability assessments and penetration test. The maturity level of its cyber security and supplier chain is constantly monitored through cyber security rating and risk exposure services. Italgas conducts systematic internal audits of its IT infrastructure and information security systems to ensure compliance with internal policies and international standards. From the end of 2023, Bludigit has an Information Security Policy in line with the ISO/IEC 27001:2022 standard and its extensions ISO/IEC 27017:2021 and ISO/IEC 27018:2019. In 2024, Bludigit successfully completed the audit conducted by the certification authority, as required annually, to confirm the proper management of the information security system. The Group has established clear and accessible procedures for all employees to report security incidents, vulnerabilities, or suspicious behaviour. These escalation processes define responsibilities and include specific training to support appropriate and timely responses. In line with digital transformation initiatives and with respect to information and data management, the Group conducts training courses and awareness sessions on cyber risks and information security topics to all employees and suppliers. In the last three years (2022-2024), there were no cybersecurity incidents that generated data breach events or compromised corporate systems. As a means of greater protection, Italgas has an insurance policy to cover cyber incidents.
CUSTOMER SATISFACTION SURVEY RESULTS
The Customer Satisfaction Survey conducted in 2024 played a key role, measuring the degree of satisfaction of sales companies through 48 questions divided into 9 areas. The results show a considerable improvement, with an increase compared to the previous years, indicating an increasing degree of satisfaction.
| Satisfaction Measurement | Unit | FY 2021 | FY 2022 | FY 2023 | FY 2024 |
|---|---|---|---|---|---|
| Satisfaction Measurement | Percentage of satisfied respondent | 66% | 73% | 81.7% | 82.2% |
| Data coverage: | % of sales companies invited | 100% | 100% | 100% | 100% |
| Minimum % of redelivery point represented by respondent | >83% | >91% | >92% | >91% |
COPORATE GOVERNANCE
As at 31 December 2024 the average tenure of Italgas’ Board of directors was 3,67 years calculated in line with the CSA methodology. Italgas’s Bylaws do not contain provisions that further exclude or limit the liability of directors beyond what is established by law.
ETHICS AND COMPLIANCE
The Italgas Group operates on the basis of a Corporate Management System comprising an Organisational System and a Regulatory System that defines roles, responsibilities, powers and rules of conduct to be upheld in going about the corporate business. The Corporate Management System is updated continuously with a view to guaranteeing the effectiveness and efficiency of processes, safeguarding the company’s assets and ensuring compliance with legislation, thereby allowing Italgas to also direct the management and coordination of the subsidiaries. The correctness and transparency of business management aim not only to ensure a correct management model and dialogue with stakeholders, but also to prevent corruption.
On 14 December 2023, the Italgas S.p.A. BoD approved the update of the Code of Ethics (general essential principle of the 231 Model adopted by Italgas and by the Group companies in accordance with Italian Legislative Decree no. 231/2001) in order to optimise the Italgas Group commitment to protecting cultural and landscape heritage. The Code of Ethics, available on the Company’s website, is a collection of the values that the Group recognises, accepts and shares and the responsibilities it assumes within and outside of its organisation. The Code of Ethics recalls the principles of corporate responsibility that must be respected, inter alia, in the areas of sustainability, the prevention and fight against corruption, health and safety in the workplace, relations with stakeholders and suppliers, and personal data protection. The Code of Ethics applies with regard to all “Italgas people”, i.e. directors, statutory auditors, management and employees of the Group, as well as all of those who work to achieve its objectives, each within the scope of their functions and responsibilities.
During 2023 and 2024, comprehensive trainings were provided to all employees’ categories (including full-time, part-time and temporary) as well as contractors, covering the following subjects: Code of Ethics, Model 231, Anti-corruption, Antitrust and Data Protection
WHISTLEBLOWING
The Whistleblowing Procedure complies with applicable laws and the Company’s Model 231. It is a mandatory tool under our Anti-Corruption Procedure and forms an integral part of the internal control system for corporate reporting. The Procedure applies to Italgas and its subsidiaries. To facilitate the submission of reports, a dedicated communication channel—hosted and managed by an independent third party—is provided as outlined in the Procedure. The Internal Audit unit oversees its operation. Each report is reviewed by an internally appointed Committee composed of the Chief People, Innovation & Transformation Officer, the General Counsel, the Chief Group Security Officer, and the Head of Internal Audit. This composition ensures the necessary independence, confidentiality, and expertise. Upon completion of the review, reports are classified with due consideration of any evidence of violations of the internal control system, the Company’s Model 231, fraud, corrupt practices, or other issues (e.g., breaches of the Code of Ethics, workplace harassment, theft, security breaches, etc.). The Committee is responsible for promptly informing senior management and keeping the Company’s 231 Supervisory Body aligned for appropriate evaluation and action. All reports are treated as confidential.
All Italgas organizational units and subsidiaries involved in receiving and handling reports must ensure the complete privacy and anonymity of whistleblowers. Appropriate criteria and communication methods must be used to protect both the integrity of individuals mentioned in the reports and the anonymity of those submitting them, safeguarding them from any form of retaliation. Reports may also be submitted anonymously, and a zero-tolerance policy for retaliation is strictly enforced. Italgas employees receive training on whistleblowing-related topics
In the following tables, data reflect 100% of revenues, 100% of consolidated operations and FTEs as at 31 December of
each year.
REPORTING ON BREACHES
| Reporting Areas | Number of breaches in 2022 |
Number of breaches in 2023 |
Number of breaches in 2024 |
|---|---|---|---|
| Corruption or Bribery | 0 | 0 | 0 |
| Discrimination or Harassment | 0 | 0 | 0 |
| Customer Privacy Data | 0 | 0 | 0 |
| Conflicts of Interest | 0 | 0 | 0 |
| Money Laundering or Insider trading | 0 | 0 | 0 |
In 2024 there were no convictions or commuted fines for corruption or bribery incidents
MEMBERSHIP OF ASSOCIATIONS AND POLITICAL CONTRIBUTION
| € | FY 2020 | FY 2021 | FY 2022 | FY 2023 | FY 2024 |
|---|---|---|---|---|---|
| Lobbying, interest representation or similar | 77,990 | 90,640 | 122,119 | 198,542 | 193,854 |
| Local, regional or national political campaigns / organizations / candidates | 0 | 0 | 0 | 0 | 0 |
| Trade associations or tax-exempt groups | 535,973 | 573,995 | 743,778 | 765,312 | 929,447 |
| Other | 0 | 0 | 0 | 0 | 0 |
| Total | 613,963 | 664,635 | 865,897 | 963,854 | 1,123,301 |
| Data coverage (operations and revenues) | 100% | 100% | 100% | 100% | 100% |
LARGEST CONTRIBUTIONS AND EXPENDITURES
| € | FY 2024 |
|---|---|
| Proxygas | 420,00 |
| GD4S | 91,500 |
| Eurogas | 90,000 |
| Utilitalia | 83,750 |
| Confindustria | 40,327 |
DIALOGUE THROUGH PARTNERSHIPS
| Proxygas | Proxigas – formerly known as ANIGAS. This industry Association, a member of Confindustria, represents firms operating along the entire natural gas supply chain with a particular focus on the following sectors: distribution, transportation, sale of natural gas on the end market and wholesale market, trading and methane for motor vehicle use. The association aims to support the role of natural gas, LNG and renewable gases as energy sources with lower environmental impact, especially when compared to other fossil sources. In 2024, its policy priorities were centered on two key areas: security of supply and emission reduction strategies in the residential sector. On the first, Proxigas advocated for a balanced approach reconciling security,affordability and sustainability, acknowledging the continued strategic role of gas in the coming years. On the second, the association – together with other sectoral organizations – supported a study conducted by an independent consultancy firm (BIP) showing that, given the characteristics of the Italian building stock, only a limited share can be decarbonized exclusively through electrification. Instead, a combination of electricity and gas solutions – particularly with the progressive ramp-up of renewable gases – emerges as the most effective pathway to reduce GHG emissions in the residential sector. In July 2025, Pier Lorenzo Dell’Orco, CEO of Italgas Reti, was elected President of Proxigas for a two-year mandate. |
|---|---|
| Eurogas | Eurogas is a European association playing a key role in advocating for the transition to carbon neutrality in the energy sector. Its activities focus on harnessing the potential of different gases – particularly renewable ones – to support a sustainable energy future. In 2024, the association’s main areas of engagement included: Security of Supply, promoting a market-based approach where possible, while addressing the challenges of the Ukrainian crisis and the need to reduce gas imports from Russia. Gas Market Design, contributing to the final stages of the Gas Regulation and Gas Directive, with specific attention to the coordination of national transposition and the inclusion of the gas sector in the “DSO Entity”. Methane Emissions Regulation, working alongside other associations to clarify the implementation of the new rules. Energy Performance of Buildings Directive (EPBD), closely monitoring the Commission’s guidelines and strategies for residential decarbonization. In addition, Eurogas commissioned an independent study from Frontier Economics to assess the role of gases in the decarbonization process. The study compared different pathways based on renewable gases, electricity, and other options such as CCSU, highlighting the most effective and cost-efficient solutions |
| GD4S | GD4S is a non-profit associationunder Belgian law gathering the voices of the largest natural gas and renewable gas distributors in Europe in 10 European Member States: France, Greece, Ireland, Italy, the Netherlands, Portugal, Romania, Spain, UK (since 2024) and Poland (since 2025). The association’s mission is to represent the views of the gas distribution sector at European institutions, specifically concerning the role that such infrastructures can play in the energy transition process towards a low carbon economy. In particular, the association supports biomethane development and use for space heating and gas and LNG as fuels for the transport sector, the study and implementation of Power to Gas technologies for the production of “green” hydrogen and its use as energy carrier able to carry and store renewable energy, taking advantage of the existing infrastructure now used for natural gas. In 2024, GD4S concentrated on several key dossiers, including the final revision of the Gas Package, the Methane Emissions Regulation, and the Energy Performance of Buildings Directive (EPBD). In early 2025, the association organized the event “Biomethane Connect Europe” in Paris, specifically aimed at supporting biomethane development through exchanges of views among policymakers, farmers, industrial representatives, and infrastructure operators. |
| Confindustria | Confindustria is Italy’s most important organisation representing entrepreneurs, grouping more than 153,000 manufacturing and service companies, with a total of more than 5 million employees. The association aims to support the role of business as an engine for the economic, social and civil growth of the country. In this perspective, it defines common paths and – while respecting the areas of autonomy and influence – shares objectives and initiatives with the world of economics and finance, national, European and international institutions, PA, social partners, culture and research, science and technology, politics, information and civil society. By representing companies and their values at institutions of all levels, Confindustria contributes to social well-being and progress, and from this standpoint guarantees increasingly diversified, efficient and modern services. |
In the following tables, data reflect 100% of revenues, 100% of consolidated operations and FTEs as at 31 December of each year, if not specified otherwise.
Employees data are available in the Integrated Annual Reports and Presentations and in the presentation Italgas Employee Data
For more details on Employees Development Programs refer to the dedicated webpages and to the presentation Employee Development Programs
LABOUR PRACTICE PROGRAMME
Italgas is committed to ensure the effective management of its labour practices, in line with the objectives outlined in its Code of Ethics and policies, through robust and dedicated labour programs.
Italgas has sets itself, as part of its Sustainable Value Creation Plan and Remuneration Policy a clear commitment to reduce the gender pay Gap, setting intermediate targets, assigning responsibilities and systematically monitoring progress with the aim of steadily reducing the gap, with the long-term goal of achieving equal pay for men and women, without discrimination based on gender. In order to guarantee pay fairness, including in terms of gender balance, in 2024 Italgas defined a specific indicator aimed at reducing the Gender Equity Pay Gap, based on the principle of “equal pay for equal work”, not only to promote fairness and justice in the workplace, but also to contribute to better motivation and satisfaction of employees in order to reduce turnover while at the same time attracting talent and improving company performance. The Gender Equity Pay Gap indicator thus identified is therefore based on the average hourly wages of the Group’s women and men according to their clustering based on the organisational weight of the position held (so-called “grade”) and homogeneous professionalism. In 2024 the Company reviewed, also with the support of external consultants, the grade of all the organisational positions, resulting in an update of the overall organisational mapping.
The Gender Equity Pay Gap is monitored on a monthly basis and used as a tool to ensure equal remuneration in fixed salary review, promotions and new hires, making sure that compensation is aligned with guidelines set by the tool, as well as monitoring on the progress made over the achievement of annual and long-term targets set in the Strategic Plan (+/- 3% Gender Equity Pay Gap by 2030). Short-term incentive of Group’s CEO of 2025 remuneration (weighted 5%) is linked to the progress made towards long-term target for Gender Equity Pay Gap mentioned before, with specific objective set on a yearly basis and approved by the Board of Directors.
Remuneration is based on collective contract. Italgas takes an active part in the drawing on them and guarantees to its employees equal and adequate remuneration, in line with the provisions of such agreements and industry standards, at levels above living wage. Meetings with trade unions and working representatives are held, in compliance with set time frame, to timely adjust the inflationary effect on wages level set by the collective agreements. The company collaborates with independent and highly specialised advisors, using specific remuneration benchmarks updated at least annually, in order to ensure that all Group employees receive fair remuneration in line with the main market and governance practices.
Internal programmes, like Wellgas, are designed to offer all workers social protection coverage beyond public programs: examples are economic support for childcare, maternity leave support with integration of salary beyond the limit set by the law, increased father leave, initiatives and services aimed at improving health: medical prevention, physical activities, mindfulness programs, psychological support, advices from contracted nutritionists.
Particular attention is paid to work related topics: all employees are supported to take their annual leaves, employees are paid for overtime work receiving an enhanced compensation, in line with the provisions of their national contracts and working hours. The Group is committed to avoid excessive working hours. Overtime work, including remuneration, is regulated by collective agreement (CCNL), with a higher level of remuneration compared to standard working hours. Data on overtime and annual leaves are monitored monthly and shared with top management and overtime is managed through shift and schedule management. Specific initiatives were carried out, particularly on paternity leave, including a dedicated internal communication campaign aimed at encouraging male employees to take advantage of their paid annual leave.
To manage overtime, the Group also leverages on optimisations algorithm for the dispatching of workers on the field, with the aim of increasing efficiency of dispatching and reducing undue overtime. Paid annual leave of each employee is monitored regularly through internal employee management systems and specific targets were set in 2024 to managers across all the organization to favour full utilization of paid annual leaves in their teams.
Italgas maintains a constant dialogue with trade unions and workers representatives, both in Italy and in Greece, on several topics including working conditions. The establishment of joint bodies and the setting up of the RSU Coordination Committee promotes continuous dialogue, allowing the Group to directly collect the concerns of employees and transform them into concrete actions. In 2024, the discussion was also extended to issues relating to health and safety at work with the members of the RLS Coordination Committee. Significant agreements were reached on topics such as the reorganisation of fundamental services following innovation and digitisation, the review of smart working, discussions on employment dynamics and the reinternalization of fundamental services, as well as the signing of agreements for funded training, the definition of bonuses and collective agreements. Italgas regularly engages with trade unions and workers’ representatives, including meetings related to the discussion and renewals of collective agreements in line with the prescribed time frame, as well as additional meetings scheduled every year regarding additional aspects of employees working conditions and wellbeing.
Italgas is aware that the main challenges of the digital transformation of the gas distribution sector are people-related, for this reason, the Group has included a commitment in its 2024-2030 Sustainable Value Creation Plan to continue investing in upskilling and reskilling activities, setting a target of 45 hours of training per year per employee by the end of the Plan, with a specific focus on digital learning and matters relating to ESG. For this reason, the digitization process – designed also to support the company to face climate transition risk and opportunities – is accompanied by a commitment to support Italgas’ workforce through upskilling and reskilling initiatives, allowing employees to effectively navigate and anticipate the changes brought by digital transformation. This innovative approach has proven increasingly effective in providing the people of Italgas with the skills and tools necessary to interpret and use the vast amount of data generated daily by the IoT sensors installed in the infrastructure. We invest significantly in the development and training processes, with the aim of inspiring and guiding the behaviors of all our people in the path of profound transformation that we have started.
In addition, to guide the reskilling and upskilling of the Group’s people, and to encourage the acquisition of the skills necessary to achieve the ambitious objectives of our strategic plan, we have set up a Corporate Academy. IG Academy expresses our leadership model and develops training programs based on three pillars: Excellence, People and Innovation.
TRAINING
In 2024 we pursued in our commitment towards training (target: 45 hours per employee by 2030), achieving a total number of hours of training per employee of 45.
On average, we spent 400 euros per employee on average for training. Training and development programmes are extended to both full-time and part-time employees, as well as contractual employees.
EMPLOYEES SUPPORT PROGRAMS
Italgas plays deep attention to employees health, safety and well-being also through dedicated support programs. On the back of the experience matured in the Covid phase, we have decided to support our people to find the appropriate balance between private life and working life, activating psychological support paths, promoting active listening channels, together with the promotion of a series of related initiatives to health, prevention, well-being, stress-management (in and outside the workplace), mindfulness, sport and attention to nutrition.
Italgas targets 90% employee participation by 2030 to its Welfare Programme.
Family: Support to family management is provided and, in particular, with attention to children and elderly relatives. For examples, we do provide economic support for childcare (2.000 euro/son at year), scholarships for students at their first year at college, loan for school expenses (e.g. books, accessories… ), voucher for online lessons and loans up to 5,000 euro with rates close to zero to be repaid in 3 years with deduction from salary for determined familiar circumstances to be approved. We organize also summer camps of 2 weeks for children up to 17 years. We also support maternity leave. On top of the benefits provided by law, we integrate the salary paid during the period of compulsory leave ensuring the employee receives ts full salary, ie an additional 20% on top of the 80% set by law. Paternity leave is also extended beyond the terms set by law, allowing all new fathers to take an additional 5 days – equivalent to 1 working week –of paid paternity leave, in addition to the 10 currently set by law
Remote working and flexible working arrangements:
By Italgas’ Remote Working agreement, which can be activated on a voluntary basis and in two ways – weekly or monthly – we not only guarantee greater flexibility but confirm our commitment to protect our people and the individual specificities and uniqueness of each one: for this reason, there is the possibility to take advantage of an additional 40 days of remote working per year to support pregnancy, paternity leave, parenting, to protect fragile individuals or those coming back to work after a long period of illness, certified gender harassment and to assist relatives or minors including those with specific learning disorders. Moreover, we also guarantee flexible agreements to employees to further facilitate the work-life balance , such as part-time contracts and Italgas also provides flexible working hours, with time windows that allow employees to adjust their arrival and departure according to personal needs.
Sport and Health initiatives: Initiatives and services aimed at improving health: medical prevention, physical activities, mindfulness programs, psychological support, advices from contracted nutritionists. Supplementary Pension. The Fondo Pensione Fondenergia is the supplementary pension fund of the Italgas Group that ensures associated workers maintain their standard of living upon termination of employment, thanks to the creation of supplementary income to the public pension. With the aim of wanting to create a place dedicated to the well-being of our employees, we have inaugurated and launched the “IGym” gyms in the Milan, Turin, Rome and Athens offices. The gyms, accessible to all colleagues for free, are equipped with showers and changing rooms and organized into fitness areas, with the presence of personal trainers always present and ready to help our people keep fit!
PERFORMANCE APPRAISAL
Being performance appraisal seen as an opportunity for professional growth, the example of IGrid Italgas places great emphasis on the development of its people and performance management represents one of the fundamental pillars of Italgas’ people development plan, implemented through multiple projects. In 2024-2025, the mapping of potential assessments continued, also with the objective of updating the empowerment, coaching, mentoring and reverse mentoring paths and the succession planning.
One major example of performance evaluation is IGrid Peformance Evaluation, which replaced since 2022 the previous 9-Box Mapping – used since 2018 – and it is based on the Italgas Leadership Model and on the Performance expressed during the year. The annual evaluation involves direct line managers and other managers in the broader unit, heads of the functions and HR managers using a 16-box mapping of possible crossover groups, considering the performance achieved, also team-based and the leadership. The multi-dimensional approach and the provision of multiple evaluators involved is designed to consider multiple feedbacks as for a 360 mapping, starting with a self-assessment phase. With the IGrid Peformance Evaluation, the Group seeks to identify people to be included in role development activities and those to be valorised through the offer of accelerated development programmes. In 2024 all employees of the Group companies were evaluated, including full-time and part-time employees, as well as blue collars in Italy. Moreover, in order to ensure the implementation of the Strategic Plan and the achievement of business objectives, Italgas has defined for Management annual incentive systems with a short- and medium-to-long-term time horizon that takes into account individual, team and corporate performance objectives. Middle managers (“Quadri”) have also an individual annual scorecard of objectives, to which 50% of the corporate premium is linked, in a bid to further strengthen the focus on results and assign increasing importance to merit.
Finally, for those involved in the IGrow Graduate Program, with 24 people attending the programme in 2024, including 3 new hire from the IGrow Greek Edition, aimed at training the Project Managers of tomorrow of the Group, an agile-type of performance appraisal is set on top of the existing performance appraisal process. For those attending the program, given its project-based nature and the opportunity to move across business lines within shorter timeframes, the regular checkup of performance progression and milestone achievements, involving regular conversations and continuous and ongoing feedback from managers is an integral part of the Program.
In the following tables, year-end data reflect 100% of revenues, 100% of consolidated operations and FTEs as at 31 December
HSEQE POLICY
For details on Italgas’ Group Health and Safety policy please refer to the link
HSEQE Policy Italgas.
The HSEQE policy of Italgas was discussed for oversight by the Board in December 2024. The Board approves the Strategic Plan and the Sustainable Value Creation Plan of the Group. The Board approves the sustainability targets of the group, including those related to the environment and health and safety and monitors the performance of the group towards the targets. The Policy applies to all Italgas Group companies, partners and stakeholders along the entire value chain.
LOST
TIME INJURY FREQUENCY RATE AND FATALITIES EMPLOYEES
| 2019 | 2020 | 2021 | 2022 | 2023 | 2024 | |
|---|---|---|---|---|---|---|
| Current Year Lost Time Injury Frequency Rate Employees | 0.98 | 1.07 | 0.61 | 2.02 | 1.60 | 1.56 |
| Fatalities | 0 | 0 | 0 | 0 | 0 | 0 |
| Coverage (revenues / operations) | 100% | 100% | 100% | 100% | 100% | 100% |
LOST TIME INJURY FREQUENCY RATE AND FATALITIES CONTRACTORS
| 2019 | 2020 | 2021 | 2022 | 2023 | 2024 | |
|---|---|---|---|---|---|---|
| Current Year Lost Time Injury Frequency Rate Contractors | 1.85 | 1.94 | 1.71 | 2.03 | 0.85 | 1.00 |
| Fatalities | 0 | 0 | 0 | 0 | 0 | 0 |
| Coverage (revenues / operations) | 100% | 100% | 100% | 100% | 100% | 100% |
Lost time injury frequency rate was defined as: “number of injuries recorded / million hours worked
SAFETY OF NETWORK, ASSETS AND PEOPLE
The management of the safety of people, assets and clients is a core matter of Italgas strategy. The “Safety of network, assets and people” topic, as included in the Materiality Assessment (GRI-compliant) conducted in the 2023 financial year, is a recurring and relevant matter also in the Impact Materiality conducted in 2024 financial year as part of the Double Materiality process within the Integrated Annual Report 2024 and in line with the disclosure requirements set out by the European Sustainability Reporting Standards (ESRS) under the CSRD Directive. While the GRI-compliant Materiality analysis depicted a common impact on the safety of the environment, the society (including the Group’s employees and contractors), external stakeholders (such as workers in the value chain) and end-users (such as the local communities), Double Materiality in line with the new ESRS led to the decoupling of the impact into two main impacts: the first relating to topical standards S1 (Own workforce) and S2 (Workers in the value chain), concerns the protection of the health and safety of direct employees and contractors within the Group’s direct operations and those engaged along the value chain; the second associated with topical standard S3 (Affected communities), addresses local communities and end users, with particular focus on the effects that business activities may have on the territory and society at large through the use of Italgas’ services. As described in section “Materiality Analysis”, the GRI-compliant materiality analysis and the related material impacts have been confirmed also in relation to 2024 financial year.
Concerning the health and safety of workers, the activities carried out in the upstream stages of the value chain in which Italgas operates, including the extraction of raw materials and the processing of polyethylene and steel, can pose risk s to the health and safety of workers as they are in close contact with hazardous machinery and harmful substances, which, in the absence of appropriate training and protective equipment, can put the health of those in contact with them at risk. Similarly, the Group’s direct activities, in particular the installation and maintenance of gas and water meters, expose employees to risks of accidents.
Concerning local communities and end-user, the activities carried out along the Group’s value chain and in its direct operations may have potential consequences for society and for consumers/end users’ safety, who might be forced to evacuate their homes or face risks to their well-being. Potential issues related to the integrity of the assets managed by the Group could result in gas leaks or other failures, with potentially significant impacts on communities located near gas extraction and processing sites, as well as raw material production and processing facilities. Incidents in these areas could cause potential irreversible damage to both people and the environment.
In addition, maintenance and repair activities on the assets managed by the Group may potentially affect everyday life in the areas concerned. The need to restrict or reorganize public spaces during construction works can lead to traffic congestion and inconvenience for local communities. These temporary disruptions, although necessary to ensure the integrity and safety of the infrastructure, underline the importance of careful planning and close coordination with local authorities to minimize potential adverse effects on citizens’ daily routines.
To further strengthen risk management, the Group has developed Territorial Emergency Plans for each distribution plant. These plans map out equipment, tools, local contractors, public authorities and institutions, sensitive customers, reduction groups, interceptor valves, and critical points (e.g., pipes fastened to bridges, crossings of major river basins, or areas affected by active landslides). This structured approach provides a comprehensive framework for anticipating and managing potential emergencies.
Italgas also generates a positive impact. In fact, the protection of the health and safety of workers is a fundamental priority for the Group, and is safeguarded through various company policies. The main one is the HSEQE Policy, which also serves as a policy for the prevention of accidents in the workplace. Through a structured and targeted approach, it focuses on eliminating hazards and reducing risks associated with work activities, with the planning of priority actions aimed at continuously improving performance and ensuring a safe working environment. Furthermore, it promotes employee training to increase awareness and sensitivity towards safety at work, encouraging good behaviour and actively involving workers at all levels of the organisation. Monitoring and control activities are carried out to guarantee maximum protection against risks related to the health and safety of employees. The management System is structured and implemented according to the requirements of the international standards of reference. The regulatory instruments put in place contribute to regulatory compliance and to ensuring the health and safety of the Group’s people (employees, end customers, contractors, etc.) and accident prevention. All Group companies have a 45001 system for occupational health and safety management. 100% of the Italgas Group employees, regardless of the type of contract, are covered by occupational health and safety management systems.
The Italgas Group is, also, committed to ensuring safe working conditions, aiming to maintain a combined accident index for employees and contractors of less than 0.15. This objective is pursued through dedicated training activities, awareness-raising meetings and opportunities to meet and discuss safety, promoting a corporate culture that is geared towards prevention and the protection of workers’ health. In 2024, meetings were held between management and employees to examine organisational and operational aspects with a particular focus on safety issues. The main safety indicators are analysed and shared with managements on a monthly basis as part of the Monthly Dashboard. In 2024, a project was launched to monitor safety conditions on construction sites with constant inspections throughout the year regarding HSE aspects, with particular attention being paid to high-risk activities that may result in accidents. More than 3,100 site inspections were carried out across the Group.
In the event of particularly significant accidents or near misses, the causes of the event and the main corrective actions to be implemented in order to avoid the event recurring in other Group companies are shared with the management and HSE bodies of their companies. Every year the “Safety Trophy” is awarded to the groups of workers (for the companies Italgas Reti and Medea) that have achieved the highest score, determined on the basis of specific HS management parameters, including accidents, both to employees and contractors, and the number of inspections carried out. The action plan includes the continuation of the actions already undertaken with a particular focus on reducing the combined accident rate and increasing the reporting of unsafe actions and conditions by workers on the Safe4You app, available to all workers on the Company intranet. The procedures are not only made available to all the Group staff specifically involved in network maintenance, control and emergency response, but also to the rest of the Italgas workforce. The Group constantly applies measures to guarantee the safety and reliability of the gas distribution network, minimising the risk of potential accidents and negative impacts on the surrounding communities and investments in the maintenance and renovation of the network. The main actions taken include predictive maintenance of the network, which allowsThese actions allow for constant monitoring of the network’s condition and identification of potential signs of wear or malfunctions before they become problematic; research and monitoring activities on fugitive emissions, including the development of operational guidelines that standardise the response to gas leaks; continuous monitoring of the performance of the aforementioned processes, enabling the timely identification of potential issues, optimisation of operations, and the implementation of corrective actions when necessary, ensuring that the network remains safe and efficient, thus reducing the overall end-user costs.
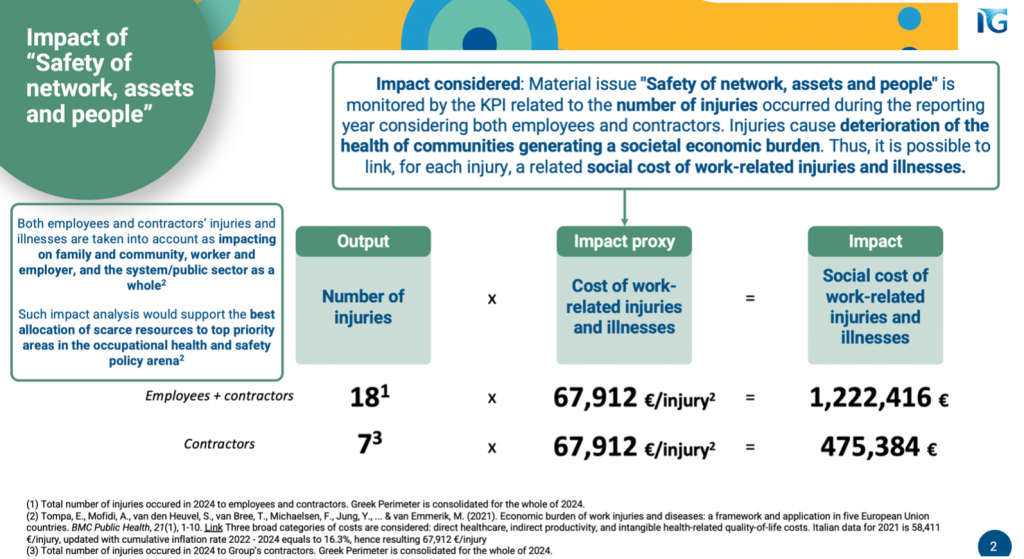
SOCIAL COST OF WORK-RELATED INJURIES
Social cost of work-related injuries represents the impact evaluation methodology to assess the external impact to affected stakeholders with regard to the issue “Failure to protect the health and safety of workers” . Output KPI (n. of injuries) was assessed through a social cost of work-related injuries, resulting in a total negative impact of approx. 1,222,416 euros. Considering that 6 injuries for the Group’s contractors occurred, the social cost of work-related injuries resulted in a total negative impact of 475,384 euros.
Italgas conducts regular local stakeholder engagement programs, applied at all local operations, especially with local authorities of the territories impacted by its operations. Such programs are performed through impact assessments to identify potential negative impacts of Italgas operations as well as maximizing value creation in local communities. To do this, the Group established clear communication channels for local stakeholder to communicate with Italgas and providing capacity building to them to effectively communicate with the Group, i.e. leaving personal contacts of local business leads within Local Institutional Relations function, as well as meetings with local authorities. Local end users have also access to relevant website section to communicate grievances.
Italgas conducts reviews to gauge local stakeholders’ perceptions on its strategy and operations also by regularly conducting meetings with relevant stakeholders to foster trust and understanding through constructive dialogue.
Italgas tracks grievances to ensure that any issue raised by local stakeholders are addressed promptly and effectively, also by a system that register all outside-in and inside-out mail correspondence. For commercial and client relations, issues are tracked through the Customer Care (https://www.italgas.it/clienti/aiuto/ ) and MyItalgas portal.
For other kind of grievances, in accordance with European regulations on whistleblowing (EU Directive 2019/1937) and their respective national implementations, the Italgas Group has implemented a new platform for managing reports regarding, for example, working conditions, discrimination, human rights violations, and safety.
Italgas press office periodically invites local media to events, press conferences, and local initiatives to present specific activities, to deepen mutual understanding, and to provide additional channels of contact with journalists who regularly cover energy and infrastructure topics.
Clear communication channels are established such as the website https://www.italgas.it/en/clients/help/ , the Gas emergency intervention freephone number – 800 900 999 and the Contact Center freephone number – 800 915 15. The Gas emergency intervention freephone number is available in all the pages of the website.
In the following tables, data reflect 100% of revenues, 100% of consolidated operations and FTEs as at 31 December of each year
STANDARD GRI 203-1 INFRASTRUCTURE INVESTMENTS AND SERVICES SUPPORTED
| SPONSORSHIP AND DONATION | U.O.M. | 2019 | 2020 | 2021 | 2022 | 2023 |
| Sponsorship | thousand euros | 671 | 1,086 | 970 | 1,443 | 1,679 |
| Liberal donations | 26 | 2,029* | 324 | 771 | 284 | |
| Total | 697 | 3,115 | 1,294 | 2,214 | 1,963 |
*86% of the liberal disbursements activated by the Group in 2020 consisted of donations to various hospitals for the purchase of machinery, equipment, and functional garrisons (such as devices for the protection of health facility personnel, inpatient beds and technical equipment) and contributed to the setting up of new areas to meet the needs arising from the emergency situation related to the pandemic and ensure hospital service.
Over the years, Italgas has implemented a robust and comprehensive ESG program for suppliers, which is constantly updated and consists of a collection of activities and measures aimed to recognize and assess potential ESG risks and, accordingly, to plan corrective measures to ensure solid sustainability performance of the Group’s supply chain.
To ensure the integrity of the supply chain and to maintain the expected quality and efficiency standards, Italgas uses a series of instruments, such as supplier qualification and appraisal processes, inspections audits and performance monitoring during the execution of contracts. Purchasing practices are continuously reviewed and updated to ensure alignment with the Supplier of Conduct and to avoid potential conflicts with ESG requirements.
Supplier screening and assessment are the step to identify, monitor and manage potential risks. Among other activities, Italgas performs systematic desk assessments with a development of specific Corrective Action Plans. Also, on-site assessment are carried out for relevant and strategic suppliers, also involving 3rd party auditors.
Supplier Development Process consists in a series of trainings regarding both Italgas’ suppliers ESG program, process and requirements, and specific workshop where case studies are shared to provide ESG benchmarking to suppliers with the final aim of spreading best practices on different ESG topics (circular economy, wastes, D&I, energy efficiency, cybersecurity).
Moreover, Italgas supports suppliers on the implementation of corrective actions identified during the Supplier Assessment, also through the implementation of capacity building programs. The aim of this initiative is to systematically improve supplier practices and performance on specific ESG topics (e.g., CO2 emissions), sharing Italgas’ objectives and targets with suppliers.
Since 2018 Italgas has set sustainability thresholds and criteria in tender procedure. Each year the model has been improved and enhanced. As well, a sustainability questionnaire compulsory for most of all qualified suppliers has been implemented and results in a rating assigned. The aim is to use the information collected to determine the general and specific level of sustainability of each supplier. The rating allows access to the Italgas Supplier Portal. If the resulting rating is lower than the set threshold, the supplier cannot be admitted to the qualification process. Average-low ratings are subjected to development plans, and an on-site audit.
In addition to qualification requirements, the sustainability score is also required as a minimum criterion for participation in tenders. Suppliers with better ESG performance are preferred by applying a minimum weight to ESG criteria in supplier selection and contract awarding. If they cannot achieve minimum ESG requirements within a set timeframe, they’re excluded from contracting.
The procurement strategy, that includes all ESG suppliers programs indicated above, has been validated by the Board of Directors and the results of the monitoring carried out are constantly subjected to top executive management, to align ESG strategies of different functions to reach Group’s sustainability goals, included in the Sustainable Value Creation Plan.
Finally, Italgas is committed to provide continuous training for buyers and for relevant internal stakeholders in their roles, in order to let them understand how their day-to-day actions and decisions are essential part of the Italgas ESG Strategy and to ensure alignment between the supplier ESG strategy and how they implement their roles within the organization.
SUPPLIERS SCREENING
Our supplier screening is an integral part of our Purchasing process. We conduct research to identify categories of suppliers that are critical for our organization, including for reaching our sustainability objectives, based also on the experience built in our day by days operations. The first step of Italgas’ supplier screening programme involves the assessment of potential Environmental, Social and Governance risks associated with country-specific operations, sector-related challenges, and commodity-specific concerns that impact both our operations, the supply chain and the potential interferences. We also consider factors such as the complexity of the supply chain, strategic importance to our operations, volume of trade, and technological impact. Our Suppliers in ‘Strategic Works and Materials’ are particularly scrutinized due to their substantial influence on both our business’s sustainable performance and Environmental, Social and Governance risks associated. By evaluating these aspects, we determine which suppliers’ category may have significant ESG risks before proceeding to a more detailed assessment phase, channelling them into the “strong” qualification process, that implies a deeper evaluation of ESG performance & risk through more detailed data collection requests for the suppliers.
SUPPLIERS ASSESSMENT AND DEVELOPMENT
The supplier assessment process of the Group’s suppliers is the step to identify, monitor and manage potential ESG risks associated with Italgas existing and potential suppliers and, at the same time, to identify and share potential areas of improvement and opportunity.
Italgas performs a systematic desk assessment which also includes verification of evidence and the definition of specific integrated Corrective Action Plan for each supplier. In addition to the audits carried out directly by Italgas personnel, also, on-site assessment (provided by a 3rd party auditing organization, accredited by the AMFORI BSCI Guidelines – Audit Business Social Compliance Initiative and in accordance with ISO/IEC 17021-1:2015 “Conformity assessment – Requirements for bodies providing audit and certification of management systems”) are carried out for relevant and strategic suppliers.
During the on-site assessment on the suppliers, also a guidance and support on the implementation of corrective and improvement actions are provided.
The suppliers’ development process of the Group’s consists in a series of trainings regarding both Italgas suppliers ESG program, process and requirements, and specific workshop where case studies are shared to provide ESG benchmarking to suppliers with the final aim of spreading best practices on different ESG topics (circular economy, wastes, D&I, energy efficiency, cybersecurity). Moreover, Italgas supports suppliers on the implementation of corrective actions identified during the Supplier Assessment, also through the implementation of capacity building programs. The aim of this initiative is to systematically improve supplier practices and performance on specific ESG topics (e.g., CO2 emissions), sharing Italgas’ objectives and targets with suppliers.”
SUPPLIER SCREENING
| Supplier Screening | U.o.M. | 2022 | 2023 | 2024 |
| Total number of Tier-1 suppliers | No | 919 | 1653 | 2,350 |
| Total number of significant suppliers in Tier-1 | No | 215 | 307 | 275 |
| % of total spend on significant suppliers in Tier-1 | % | 85% | 77% | 80 |
| Total number of significant suppliers in non Tier-1 | No | 34 | 60 | 74 |
| Total number of significant suppliers (Tier-1 and non Tier-1 | No | 249 | 367 | 349 |
SUPPLIER ASSESSMENT
| Supplier Assessment | U.o.M. | 2022 | 2023 | 2024 |
| Total number of suppliers assessed via desk assessments/on-site assessments | No | 215 | 307 | 247 |
| % of significant suppliers assessed | % | 86.35% | 83.65% | 70,77% |
| Number of suppliers assessed with substantial actual/potential negative impacts | No | 215 | 307 | 247 |
| % of suppliers with substantial actual/potential negative impacts with agreed corrective action/improvement plan | % | 74% | 77% | 70,77% |
| Number of suppliers with substantial actual/potential negative impacts that were terminated | No | 5 | 2 | 4 |
CORRECTIVE ACTION PLAN SUPPORT
| Corrective action plan support | U.o.M. | 2022 | 2023 | 2024 |
| Total number of suppliers supported in corrective action plan implementation | No | 215 | 307 | 247 |
| % of suppliers assessed with substantial actual/potential negative impacts supported in corrective action plan implementation | % | 100% | 100% | 100% |
CAPACITY BUILDING PROGRESS
| Capacity building progress | U.o.M. | 2022 | 2023 | 2024 |
| Total number of suppliers in capacity building programs | No | 215 | 307 | 247 |
| % of significant suppliers in capacity building programs | % | 86.35% | 83,65% | 70.77% |
The company is dedicated to creating a work environment free from direct or indirect discrimination, in accordance with Article 25 of the Equal Opportunities Code, from any form of violence or harassment, whether sexual or based on personal, political, or cultural differences. Italgas strives to ensure that all employees treat others with dignity, respect, and fairness at all times, reflecting an inclusive approach that aligns with the company’s values.
Italgas has been a TCFD supporter since October 2021.
In the following tables, data reflect 100% of revenues, 100% of consolidated operations and FTEs as at 31 December of each year, if not specified otherwise.
The protocol used for GHG emissions accounting is the GHG Protocol.
SANCTIONS
In 2024, just like in 2023, 2022, 2021, 2020, 2019, 2018 and 2017, the Italgas Group did not receive any significant
sanctions for breaching environmental laws and regulations.
SMART METERS
As at 31 December 2023 in Italy practically all active mass-market meters are now smart (98,2%) while in Greece
64.4k active meters out of 0.599mn are smart. Overall the % of active smart meters was 91,5% at the end of 2023.
HSEQE POLICY
For details on Italgas’ Group Environmental policy please refer to the link HSEQE Policy Italgas. The Policy applies to all Italgas Group companies, partners and stakeholders along the entire value chain.
The HSEQ policy of Italgas was discussed for oversight by the Board in December 2024. The Board approves the
Strategic Plan and the Sustainable Value Creation Plan of the Group. The Board approves the sustainability
targets of the group, including those related to the environment and health and safety and monitors the
performance of the group towards the targets.
NETWORK DIGITISATION
In 2024, Italgas strengthened its commitment to innovation and digitisation of networks and business processes, with projects and initiatives that further consolidated its leadership position in the sector.The DANA (Digital Advanced Network Automation) system has been consolidated as the single point of access to the IoT world, optimising the control and management of the digitised gas network through the remote control of cathodic protection systems and the development of artificial intelligence features for network remote control and smart document search. At the end of 2024, DANA operated in 100% of city gates and 73% of district governors (6,060 out 8,272).
ENERGY
Italgas is dedicated to sustainability and delivering long-term positive impact, as outlined in our Sustainable
Value Creation Plan (SVCP). Our commitment to fighting climate change focuses on improving energy efficiency,
reducing energy consumption, and mitigating our environmental impact. In doing so, Italgas set targets
related to energy: -27% of net energy consumption by 2028, -33% by 2030 (2020 baseline). The progress of this
goal is continuously evaluated through the monthly Sustainability Business Review process, established in 2021,
in which a detailed assessment of the main environmental KPIs – inclosing those related to energy, energy
efficiency, energy consumption reduction and energy management – is carried out. Italgas also leverages on green
energy purchase to reduce its carbon footprint.
As part of this process and in accordance with the requirements of the EN ISO 50001:2018 standard provided for in
the group’s HSEQE management system, the Group conducts periodical internal energy audits, supported by the
expertise of Geoside, the Group’s Energy Service Company (ESCo) specialized in energy efficiency, as well as
external energy audits carried out by an independent third party. Through these audits, the Group can analyze
energy consumption and efficiency based on solid data, identifying areas of significant energy use and
opportunities for improving energy performance across all energy uses (industrial, civil, vehicle fleet) while
enabling informed decision-making for the implementation of energy management programs and actions aimed to
reduce the amount of energy used.
Leveraging innovation and R&D efforts and investments, we continuously explore and implement cutting-edge
digital technologies to enhance sustainability programs and to decrease energy consumption. This includes the
development of advanced digital energy management systems, smart grid solutions, and innovative monitoring tools
that provide real-time data and predictive analytics to optimize energy use and reduce emissions such as the
“Savemixer” platform developed by Geoside.
During 2024, Savemixer functionality was extended to include the economical equivalent of energy consumption to allow for more accurate forecasting and efficient allocation of energy consumption budget.
Actions to reduce energy consumption implemented starting already in 2024 include • Digitisation for remote monitoring: intelligent platforms that optimise network pressure and flow, reducing energy consumption. • Innovative pre-heating systems: automated and innovative systems that ensure the control of gas pre-heating parameters in IPRMs (withdrawal, reduction and measurement sites), increasing efficiency. • Building energy renovations: complete energy renovations of civil business assets integrating the use of innovative monitoring and control systems.
All those systems are in integral part of our Strategic plan 2024-2030 which integrated the Climate Transition Plan. Our Innovation team also engaged in scouting for and implementing the best
technological solutions that support reduction in energy consumption such as substitution of cathodic protection
power supply units with better energy performing switching power supplies, installation of high-end batteries on
network plants to avoid loss of energy supply.
At the same time Guarantees of Origin (of produced electricity by Renewable Energy Sources) are obtained by the Group in order to cover the electricity purchased by the Grid by 93%.
In 2023 and 2024, PV plants were installed on distribution network Metering and Regulating stations and buildings of the Group with the aim of covering part of electricity consumption with self-produced clean energy.
Finally, the group provides comprehensive training and awareness programs for employees, focusing on reducing
energy consumption and adopting energy-efficient behavioral measures. Training is provided to both the whole
group employees and to specific targeted employees that hold responsibility for decision-making involving energy
management and efficiency programs.
In 2024 over 2280 hours of training on sustainable energy and energy
management have been provided, involving over 260 employees.
Gas leakage rate
Emissions considered in the calculation of the gas leakage rate are fugitive emissions and venting emissions. Please note that venting emissions are residual (less than 1% of emissions considered for gas leakage rate). Pneumatic or unburned emissions for Italgas Group areincluded in the calculation of the gas leakage rate but are equal to zero.
Nitrogen oxides (NOx), sulfur oxides (SOx) and other significant air emissions
| Nitrogen oxides (NOx), sulfur oxides (SOx) and other significant air emissions | U.O.M. | 2021 | 2022 | 2023 | 2024 |
|---|---|---|---|---|---|
| Total | tNOx | 21.1 | 16.3 | 15.8 | 12.8 |
| Coverage (% revenues) | % | 100% | 100% | 100% | 100% |
SOx and COV emissions are considered null in all reported years, as they are not significant
COVERAGE BY MANAGEMENT SYSTEM
| COVERAGE BY RECOGNISED ENVIRONMENTAL MANAGEMENT SYSTEMS SUCH AS ISO14001, EMAS OR ISO45001 | U.O.M | 2020 | 2021 | 2023 | 2024 |
|---|---|---|---|---|---|
| ISO14001 & ISO 45001 | % of sites covered (km of network) | 98.9 | 100 | 100 | 100 |
| ISO14001 & ISO 45001 | % of sites covered (revenues) | 98.7 | 100 | 100 | 100 |
Compliance with water quality/quantity permits, standards and regulations
| Nepta Campania | |||||
| ARERA Indicators | KPIs | 2023 | 2024 | delta % | ARERA target |
| M2 Service interruption | Hours of service interruption | 7.59 | 2.52 | -67% | 7.29 |
| M3 Quality of water delivered | Incidence of non-potability decrees | 0% | 0.42% | – | – |
| Samples non-compliance rate | 7.48% | 1.59% | -78.7% | -6.88% | |
| Parameters non-compliance rate | 0.45% | 0.075 | – | – | |
WASTE
Italgas Group is committed to sustainable waste management through comprehensive programs and action plans that enhance waste performance, reduce waste generation, and promote recycling. Our environmental department periodically assesses and analyzes processes and activities to evaluate and minimize waste generation and monitors performance towards targets. These waste audits help identify areas for improvement and to implement effective waste management practices. In addition, during 2024, Italgas performed specific environmental audit activities on final destination management plants in order to evaluate and analyse the environmental authorization and verify that treatment lines are compliant.
Over the years the Group has distinguished itself for its unique approach on innovation and digitization investments, also with an effort to minimize waste. At the forefront of Italgas Group’s innovation efforts are the design and development of a new H2 ready smart meter Nimbus which widespread installation will drive significant investments over the coming years.
The new smart meters were designed and developed with an effort to minimize waste. 85% of the Smart Meter is made recycled materials, including a sustainable recycled polycarbonate casing; and it is smaller, easier to transport and install, contributing significantly to a circular economy system. Further, extending its operating lifetime to 15 years – double that of existing meters – it reduces by 50% the expected substitution rate. Additionally, we focus on qualifying suppliers whose products have the longest possible life cycles, thereby extending the end-of-life period of our equipment and significantly reducing overall waste. Italgas set a target to minimize waste that is related to the installation of new smart meter: “50% of all active smart meters designed according to «Design for environment» criteria in lieu of GPRS meters by 2028”.
Furthermore, the Group widespread focus on innovation include a collaborative R&D program with the Polytechnic of Turin to develop a more recyclable battery for smart meters. In addition to this, we are investing on the development of innovative back-filling material for excavation works, facilitating reuse and avoiding waste production.
Moreover, on 2024, Italgas started a partnership with the Italian consortium for electronic waste. This agreement allows Italgas to manage the waste of the replacement of smart meters for domestic use, in a dedicated chain with the aim to recover all the materials/items (metal, plastic, batteries etc.) that are contained into the Smart Meter.
In line with these efforts, Italgas Group conducts annual waste reduction training for its employees across all sites. These training sessions focus not only on administrative and mandatory topics, but are designed to raise awareness on waste hierarchy, to guide on effective waste reduction and recovery rate maximization, trends and innovative projects. Moreover, to ensure waste is effectively recovered and reused, we select transporters and destination plants that manage waste in a sustainable way in order to integrate recycling programs to reduce waste sent to landfill. To reinforce this, we have introduced a clause requiring waste management contractors to disclose to Italgas the main categories of waste produced.
Finally, our effort of waste diversion from landfill (specifically regarding waste generated from the substitution of smart meters) is certified by an independent accredited certification company, monitored by the Ministry of Environment, thus highlighting our efforts to maximize sustainable waste management. During 2024, the Italgas Group did not receive any significant sanctions for breaching environmental laws and regulations, just like in the two previous years.
TCFD RECOMMENDATIONS
The reconciliation of the TCFD recommendation with the Integrated Annual Report 2024 is available at the 2024 TCFD Recomendation.
PHISICAL CLIMATE RISK ADAPTATION
All the specific actions presented below (that could enable the adaptation to climate change) are based on a context-specific plan and address the risks identified in specific risk analysis.
Coherently with Group Strategic Plan targets and the climate scenario analysis outcomes, the Group has identified and is currently implementing a set of specific actions that enable the adaptation to climate change, in order to anticipate the adverse effects of climate change and to take appropriate action to prevent and/or minimize the damage it can cause.
- Network: mitigating impacts and/or reducing time of intervention in case of occurrence of extreme natural events
- Replacement of grey cast iron with hemp and lead joints Timeline: Completion expected in 2025 (subject to permitting) The repurposing of the network sees, among other things, the full replacement of grey cast iron and other obsolete materials pipes with new ones to prepare the network to handle different types and blends of gases and be more effective in coupling with the consequences of climate change remote controls in case of occurrence of extreme climate events, mitigating impacts and/ or reducing time of intervention (e.g., remotely securing network portions in case of floods, fires, earthquakes).
- DANA – Digital Advanced Network Automation – the command-and-control system of the network of the future Timeline: – 2021: Project Launch (status: completed); – 2022: Installation on 21 distribution plant Italgas Reti and on 59 distribution plant MEDEA (status: completed); – 2023-2027: 100% network digitised and monitorable by DANA in Italy and in Greece (2025 for former Italgas Reti perimeter by 2025). At the end of 2024, DANA operated in 100% of city gates and 73% of district governors (6,060 out 8,272)The command-and-control system unlocks 3 major benefits: i) Ensure the monitoring of a distributed system in which physical variables are interdependent; ii) Enable remote management with commands on main processes of network and plants and increase the efficiency of the governed processes and the flexibility of the network; iii) Enable management of renewable gases (e.g., biomethane, hydrogen). It is a practical example of Italgas’ adaptation on climate risks.
- Smart maintenance initiative Timeline: – 2022: release of an initial prototype (completed); – 2023–2024: roll out plan to all Italgas distribution plants Digitization increases efficiency, improves safety, network management and the quality of the service, enables predictive maintenance, for more effective control of the operating parameters, and helps to guarantee operation under any conditions. In 2021, the development of a Geographic Information System (GIS) was started in collaboration with Picarro, of a GIS model for asset management used to design smart maintenance for the Italgas networks, with a view to extension to Group level thereafter. Continuing with the enabling of smart maintenance, new solutions have been introduced based on machine learning and AI for predictive analysis and the optimisation of the function of critical components of the network, such as smart meters and the odorisation stations.
- Radio Frequency Identification Markers in new networks Timeline: – 2019: first installation (completed); – currently ongoing (23.441 markers already installed as of end of 2022). The new distribution networks are equipped with Rfid markers, again positioned inside the excavation at an average step of 1 every 50 metres, which allow for the traceability and localisation of the pipes directly from the road level without any need for invasive interventions in the subsoil and consequent interference with traffic. In case of adverse meteorological phenomena impacting the network, this represents an effective adaptation tool allowing to intervene quickly. Real Estate: reducing office energy consumptions, mitigating the impact of an increase of annual average temperature (that would otherwise result in an increase of energy consumption)
- Building renovation Timeline: 2023-2024 The virtuous reduction of civil consumption, now an integral part of real estate management, will continue during 2023 and 2024 along the following lines: –the process to renew building stock; –installation of photovoltaic systems to increase the amount of electricity self-produced and consumed on site; –extension to all the Group’s operating sites of the ability to monitor consumption in real time and analyse it using the proprietary platform developed by Geoside, thanks to introduction of smart sensors.
- Water leakages: reducing water leakages, mitigating the impact of an increase in average annual temperature (which would otherwise lead to a decrease in the volume of available water)
- Digital transformation for Water Business Timeline: 2023-2029 Water smart meters, network (DMAs) balancing, real-time monitoring and predictive maintenance to improve network operational and energy efficiency and reduce water leakages. In 2023, installation of water smart meters, including real-time pressure sensors, began throughout the network. The subsequent subdivision of the whole network map – necessary to collect precise data on water leakages – will be completed within 2027.
- Industrial consumption: energy autoproduction to mitigate effects on energy insecurity due to the occurrence of extreme climate events.
-
- Installation of photovoltaic plants Timeline: 2023-2030 In 2023 and 2024, Italgas Reti plans to replace traditional circulators with inverter-driven electro- circulators inside thermal power plants for preheating, revamp existing photovoltaic plants with more efficient modules, as well as new installations of photovoltaic plants on both IPRMs and GRFDs, to ensure the self-production of the electricity needed to satisfy the needs of the new digitised plants.
Climate Risk Assessment – Physical and transitional risks: given the long timeframe that must be considered to fully take into the account of occurrence and/or impact of climate risks and opportunities, such events are measured both over the Strategic Plan 7-years’ timeframe and beyond it. Regarding Physical risks and opportunities of Climate Change, our climate scenario analysis is based on a third-party climate model that allows to obtain the evolution of main physical parameters up to 2050, under RCP 1.9, 4.5, 8.5 scenarios in all the local areas (up to municipal level) already served by Italgas or in those areas the Group plans to serve in the future. Physical parameters considered by the model include, for example, heating degree days and days with heavy rainfalls. Their potential impacts are then assessed on key business variables (e.g. active redelivery points), as well as considering potential damages to overall gas infrastructure (upstream and downstream relative to distribution). Regarding Transition risks and opportunities of Climate Change, they are analyzed based on several third parties’ climate and energy scenarios up to 2050 and involving key Process Owners to deepen key transition drivers (e.g. regulation, technology) and the embedded risks and opportunities. Considerations of impacts include the overall gas infrastructure (upstream and downstream related to distribution).
SOCIAL COST OF CARBON
Among other activities, it proposes and performs energy efficiency interventions for its public and private customers in a residential and industrial context. Specifically, the EPCs – Energy Performance Contracts – in place require that the savings generated following interventions be guaranteed and suitably measured. In the public sector, the main tool used is funding via third parties envisaged by Italian Legislative Decree 115/2008, often combined with the project financing, governed by the Tenders Code (Italian Legislative Decree 50/2016). The proposals are characterised by the assumption of risk, against the standards offered, at the full expense of the proposing party and the contracts provide for an economic rebalancing mechanism to the benefit of the Administration, if the minimum objectives are not successfully guaranteed. The remuneration mainly derives from the saving levels achieved, which must be able to generate the necessary cash flows to repay the investments.
The EPCs predominantly concern interventions:
- on the air conditioning systems, generally powered by methane gas;
- on the public lighting systems, powered by electricity;
- to construct photovoltaic plants, which reduce withdrawals of electricity from the network.
In 2024, these interventions made it possible to achieve the following results:
- energy produced by photovoltaic system (energy sold plus self-consumed – MWh): 2,107 MWh;
- air conditioning systems powered by methane gas (Smc): saving of 312 kSmc,
- public lighting systems, powered by electricity (MWh): saving of 10,668 MWh.
In 2024, production amounted to 9,809 MWh.
Regarding Sustainable Value Creation Plan target 280,000 MWh saved by ESCo customers, corresponding to about 62,000 tons of CO2, thanks to energy efficiency interventions implemented between 2022 and 2028″ (related to “Contribution to climate change”) the 2024 performance is 35,594 tCO2eq (of which 10,570 tCO2eq were in 2024).
Social cost of carbon represents the impact evaluation methodology to assess the external impact to affected stakeholders with regard to the issue ”Benefits from the ESCo’s network digitisation and energy efficiency work”. Output KPI (tons of CO2 avoided by ESCo activity) was assessed through a social cost of carbon, resulting in a total positive impact of approx. 909,020 euros.
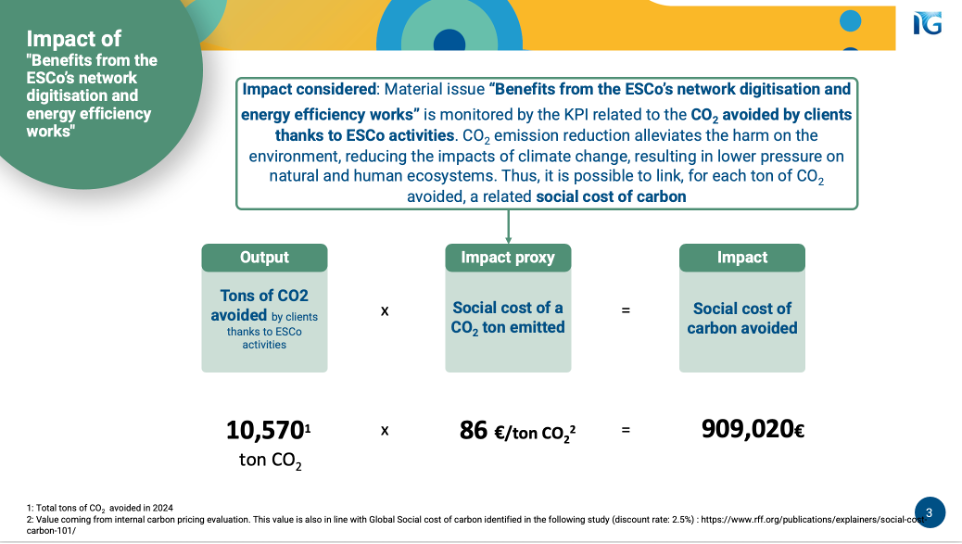
CARBON PRICING
Even though not subject to ETS scheme, Italgas Group has integrated an internal carbon price as a core element to address business strategy, decision making process and prepare to address climate change related issues, with the following goals.
- Cost-Benefit Analysis and Achieving climate-related targets
The internal carbon price (CP) at Italgas helps quantify the economic value of expected CO2 reductions. It enables the company to compare this value against the costs of an initiative, going beyond a simple evaluation of capital expenditure (capex). By using the CP, Italgas Group can assess the return on investment for carbon reduction initiatives and inform the decision-making process in order to achieve its climate-related target (including that referring to energy efficiency.
- Driving Energy Efficiency and Achieving climate-related targets
Italgas’s internal CP applies to the entire group and all its activities, providing a strong incentive to drive energy efficiency. The value assigned to carbon reductions makes projects that reduce energy consumption more economically attractive, thus supporting the Group broader sustainability goals and the acheiving of its climate-related targets.
- Driving Low-Carbon Investments
The internal CP is a key tool for supporting low-carbon investments. By assigning a notional price to carbon, the company can make informed decisions that favor projects with lower carbon footprints. This helps the company identify and seize opportunities to reduce CO2 emissions over its seven-year strategic plan horizon.
- Incentivizing Consideration of Climate-Related Issues in Decision-Making
The internal CP influences decision-making and financial planning by integrating the cost of carbon into the company’s planning process. This ensures that project teams consider the climate impacts of their decisions. The CP also supports specific projects that are aligned with the company’s CO2 reduction targets.
- Incentivizing Consideration of Climate-Related Issues in Risk Assessment
The internal CP helps Italgas navigate emerging risks associated with more stringent greenhouse gas (GHG) regulations. It serves as a navigator to potential risks that might otherwise be overlooked, thereby informing the organization’s risk disclosure and accelerating reduction initiatives.
- Identifying and Seizing Low-Carbon Opportunities
By creating a CO2 “P&L” and converting it into an economic P&L using the internal CP, Italgas can identify and seize opportunities to reduce CO2 emissions. This allows the company to proactively seek out and implement projects that improve its carbon performance.
- Influencing Strategy and/or Financial Planning
The use of an internal CP for strategic planning enforces the entire Group’s strategy. It quantifies potential risks from regulatory changes and other climate impacts, thereby informing the organization’s financial planning and ensuring that climate commitments are integrated into the core business strategy.
- Navigating Regulation and Stress-Testing Investments
Although not subject to the EU ETS system, the internal CP helps Italgas to navigate regulation by simulating the financial impact of potential future carbon pricing policies. This allows the company to stress-test investments and ensure they are resilient to potential regulatory changes, providing a proactive approach to risk management.
.
Dialogue and Priorities
Through our daily activities we aim to dialogue transparently with all our stakeholders, communicating clearly and consistently what we do, how we work, where we create value.
Discover our vision and projects
-
Our Sustainability Ambassador
From personal awareness to collective awareness: with the project dedicated to Sustainability Ambassadors, we make people protagonists of our transformation path.
-
Digitalization for the transition
With an increasingly widespread and digitized network, we contribute every day to the energy future of the country and to the development of renewable gases.
-
Innovation partnerships
We actively participate in the development of the country through strategic and innovative collaborations, which generate shared value.